Together With
👋 Hello, Best Ever readers!
In today’s newsletter, the demand map sharpens, tariffs pause, retailers go big, confidence shakes, and much more.
Today’s edition is presented by AI for CRE Collective. AI is moving fast across commercial real estate. The hard part is knowing where to start and which tools are worth your time. The AI for CRE Collective brings together 800+ brokers, investors, developers, owners, lenders, asset managers, and property managers using AI to underwrite deals, build BOVs and OMs, research markets, analyze sites, abstract leases, and automate repetitive work. Learn more.
🎤 Seven judges. $10M+ in capital looking for a home. And you get a vote, too. Meet the capital allocators taking the judges’ seats at Pitch Slam LIVE on August 26, and save your free seat to join them as the 8th judge. Reserve your free seat.
Let’s CRE!
🇨🇦 Tariff Reprieve: President Trump has paused 50% Section 338 tariffs on Canada through Friday after announcing a deal Canada described as unfinished. The duties would have hit roughly $20 billion in imports, including building materials that feed U.S. construction pipelines.
🔥 Wildfire Fallout: Wildfire smoke has pushed indoor air management up the priority list for office landlords, with 21 of the 25 hardest-hit metros recording unhealthy pollution for six straight days in July. Durst now tracks seven air metrics across 16M SF.
🏠 Rent Burden: Families with children are getting hit hardest, with 54% now cost-burdened as median annual rent reaches $21,480. Nearly half of all U.S. renters spend more than 30% of income on housing, a share that has held near 50% for years.
🏪 Bigger Boxes: Retailers have posted a net loss of 144 stores through July while adding 26.1M SF, as incoming locations averaged nearly 80% more space than closures. The store-count gap narrowed sharply from 1,778 net closures a year earlier.
💵 Tighter Terms: Small multifamily originations reached an annualized $71.6 billion through the first half, topping 2025's full-year total by 2.8%. Debt yields climbed to 9.6% while LTVs slipped to 63.4%, leaving less leverage against property income.
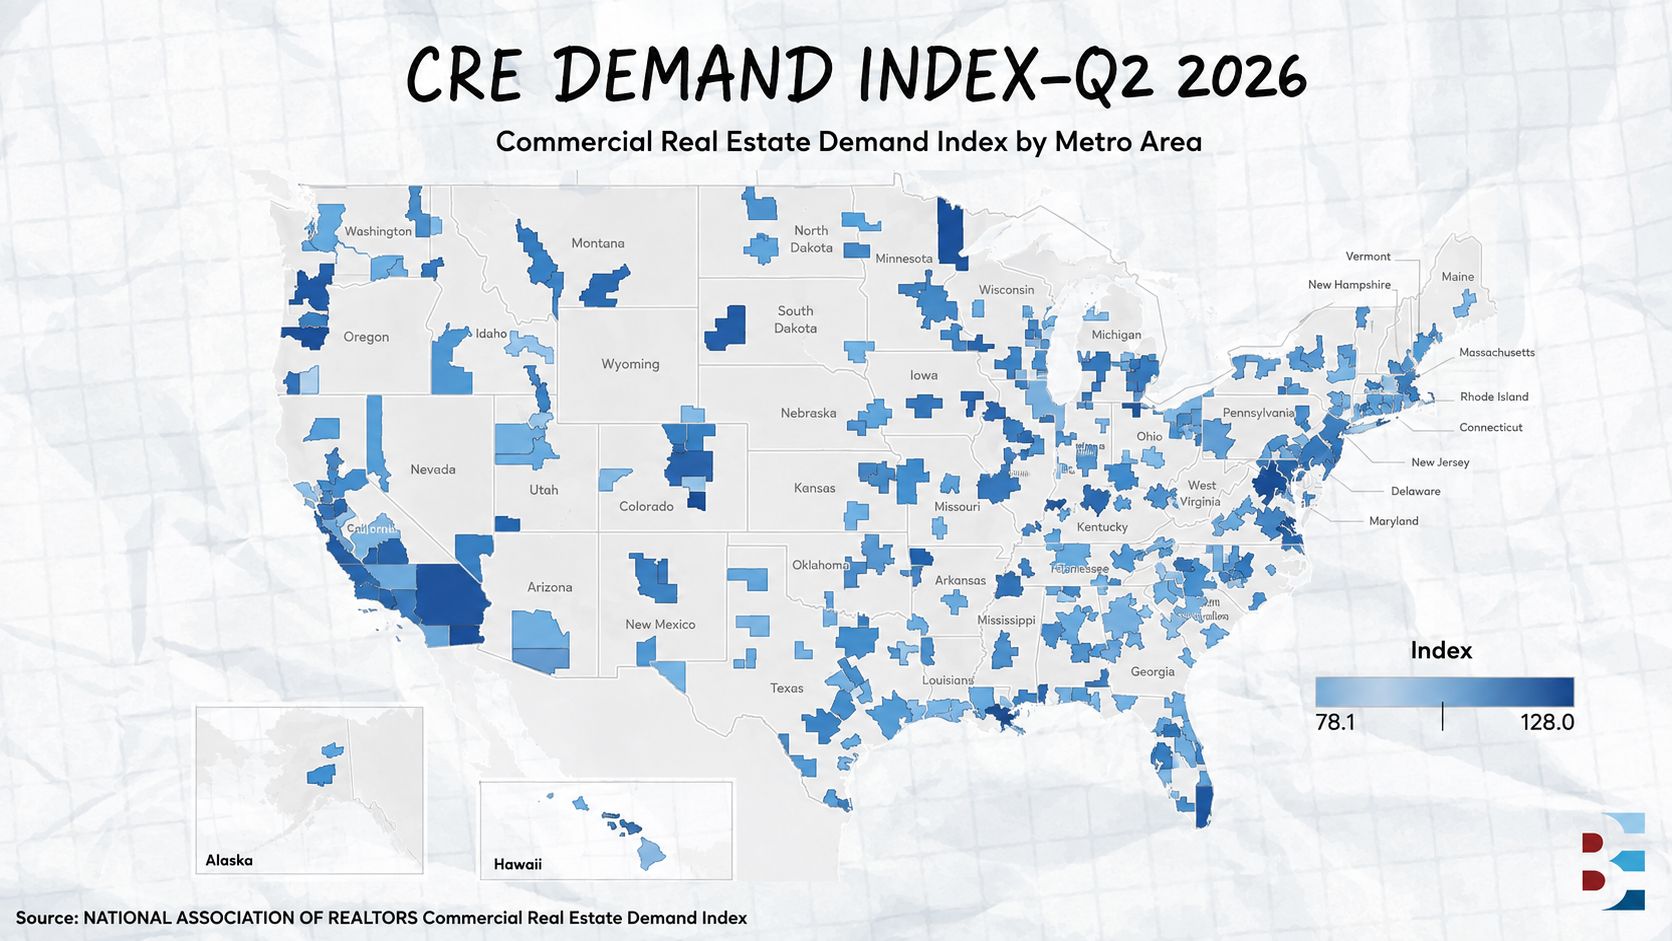
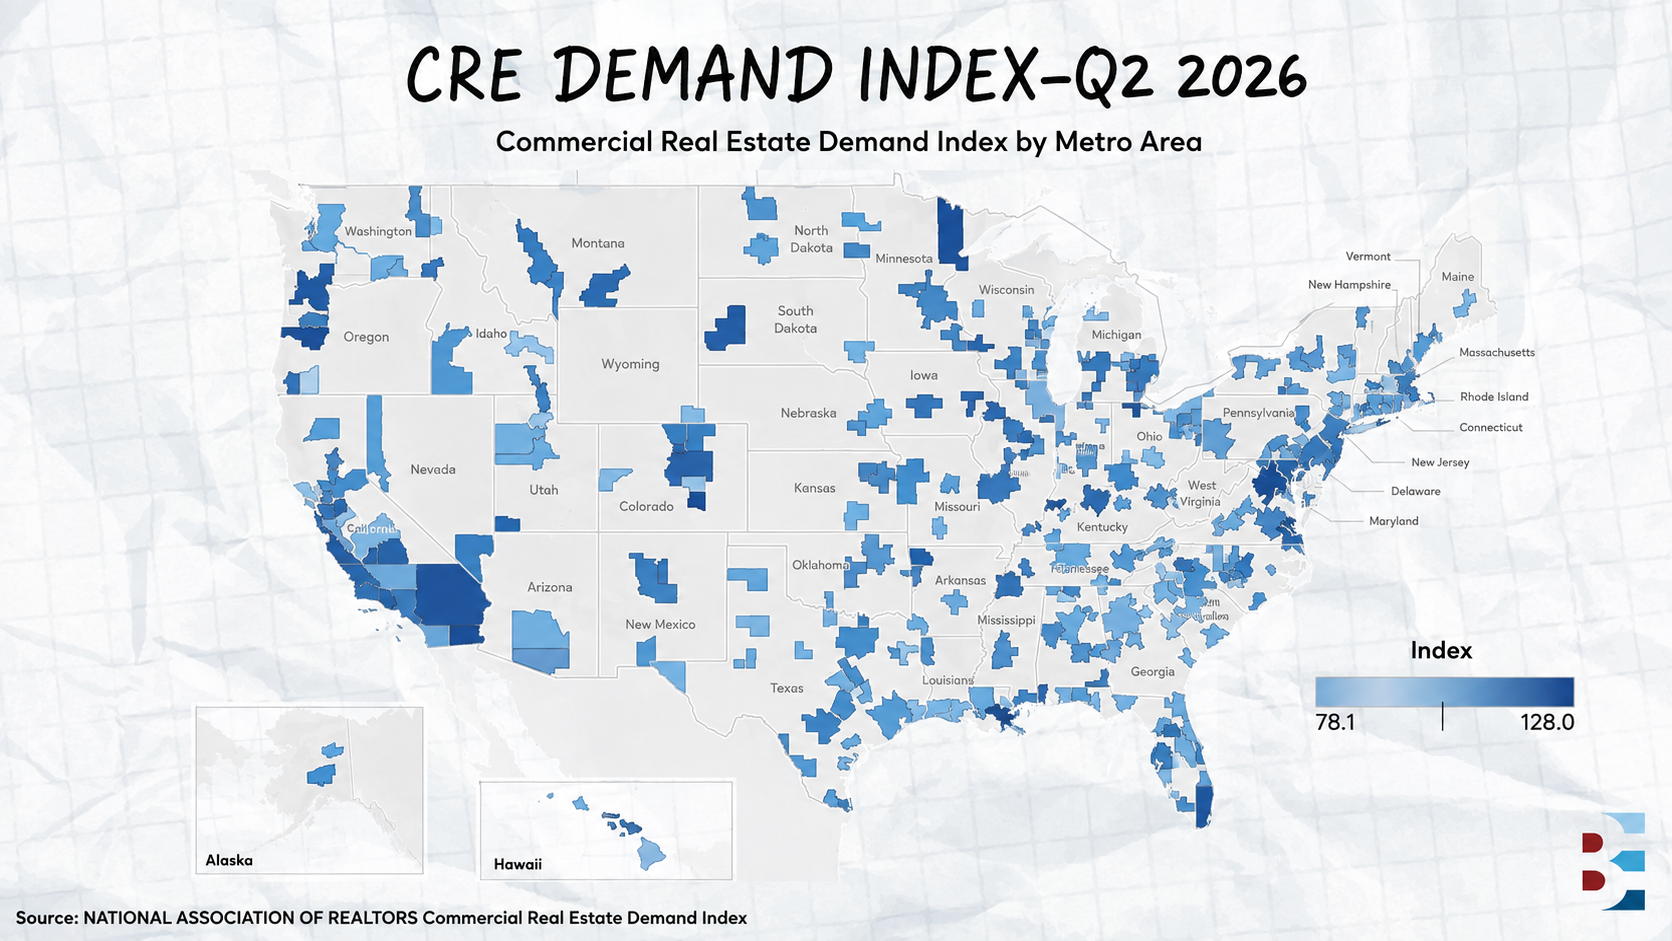
A metro of 200,000 in southwestern Utah now ranks first in the country for future CRE demand — ahead of Austin, ahead of Miami, ahead of every market that dominated investor conversation for the last four years. That finding comes from the National Association of Realtors' Commercial Real Estate Demand Index, a new quarterly measure launched this week that tracks 306 metros using employment and migration data to flag demand before it surfaces in rents, vacancy, or leasing.
The index scores every market against a national average of 100, with each 15 points representing one standard deviation. What it exposes is a full reversal of the geography operators built portfolios around.
Austin peaked at 135.7 in Q3 2022 and now sits at 115.6, a 20.1-point slide that tracks the market's supply glut and cooling in-migration. Professional and business services employment there has grown just 1.9% YoY.
Naples has been cut down harder than any boom market on the list. The metro scored 127.8 in Q3 2022. It now sits at 94.5, below the national average and ranked 226th. Manufacturing employment there has contracted 4.1% YoY while retail trade employment is down 2.6%.
Miami has crossed from strength into weakness. After peaking at 116 in Q4 2023, the metro has dropped to 96, ranking 198th, with negative readings across transportation, manufacturing, leisure and hospitality, and retail trade. Both net migration and population growth turned negative in 2025.
Raleigh is the exception. At 121, it ranks highest among the 50 largest metros and is the only major market stronger today than it was during the 2022 migration peak. Above it sit metros most institutional screens never surface.
The Carolinas Lead Nationally: South Carolina ranks as the strongest state in the index, with demand momentum concentrated in secondary markets rather than the metros that drew capital in 2021 and 2022.
Small Metros Are Outrunning Big Ones: St. George scores 128 on the back of 15.5% growth in professional and business services employment, 2.5% population growth, and 2.2% net migration. Fayetteville, AR, and Huntsville, AL, show similar broad-based strength, with Huntsville posting one of the highest multifamily scores in the country.
Sector Divergence Is Widening: Salem, OR, and Fairbanks, AK, top the industrial rankings — markets that appear in almost no institutional screening model. The index breaks out office, industrial, retail, and multifamily separately, with industrial and multifamily carrying the most weight.
The index measures inputs, not outcomes. A score below 100 doesn't mean a market is shrinking — Naples is still adding residents, just slower than the average metro. What the scores capture is the trajectory, not the level, which is the part underwriting tends to get wrong.
Deals underwritten in 2021 and 2022 assumed the demand drivers in Austin, Miami, and Naples would hold. Those assumptions are now measurably wrong, and the gap shows up first in lease-up velocity and renewal pricing rather than in headline occupancy. Operators sitting on Sun Belt exposure have a cleaner way to test whether their rent growth assumptions still have economic support behind them, and operators hunting acquisitions have a screening tool that points somewhere other than where everyone else is looking.

Join 800+ CRE professionals using AI to underwrite deals, build BOVs and OMs, research markets, screen sites, abstract leases, review operating reports, and automate repetitive work with AI for CRE Collective.
Inside, you get:
✓ AI for CRE Certification and role tracks for every CRE seat
✓ 500+ hand-tested tools with member-only discounts
✓ 300+ workflows, 500+ prompts, and CRE AI skills
✓ Live workshops, monthly member huddles, and weekly office hours
✓ Advanced masterclasses, including the $599 Claude for CRE course
✓ A community sharing what works on active deals and assets
Start free for 7 days and get full access. Bring one task that is eating your time, find the workflow built for it, and use the community or office hours when you get stuck.
Underwrite a live deal, draft the BOV, abstract the lease, research the market, or automate the report before the trial ends.
Finish the Certification in your first 30 days. If you don't get your first win, we refund your entire first month. Cancel anytime.
START FREE FOR 7 DAYS
The challengers are bringing the deals. These are the people they have to convince.
On August 26 at 12 PM ET, seven fund managers and capital allocators will take the judges' seats at Pitch Slam LIVE. Together, they're actively looking to place $10M+ in capital and bring experience spanning billions of dollars in CRE acquisitions, investments, lending, and capital formation.
They'll put each opportunity to the test during live Q&A, cast their Pursue or Pass votes, and ultimately help crown the August Pitch Slam Champion.
👤 Nishant Sondhi | Sondhi Capital Group
17 investments representing ~$600M in aggregate asset value
👤 Manish Poddar | Wealthify Capital
$200M+ in multifamily transactions as GP and co-GP
👤 Bronson Hill | Bronson Equity
$60M+ raised across real estate and private equity
👤 Chris Larsen | Next Level Income
$120M+ deployed • $2B+ in CRE acquisitions
👤 Yakhin Israel | Twin Pillar Capital
25 years in CRE • $2B+ in opportunities
👤 Peter Mathews | CGM Alternatives
Institutional CRE valuation background • 200+ investor network
👤 Paul Shannon | Investwise Collective
40+ LP investments • $10M+ raised
And they don't get the only vote. You’re the 8th judge. Watch every pitch, evaluate the deals alongside the panel, and cast your own Pursue or Pass vote.
📅 August 26 | 12 PM ET
MEET THE JUDGES & RESERVE YOUR FREE SEAT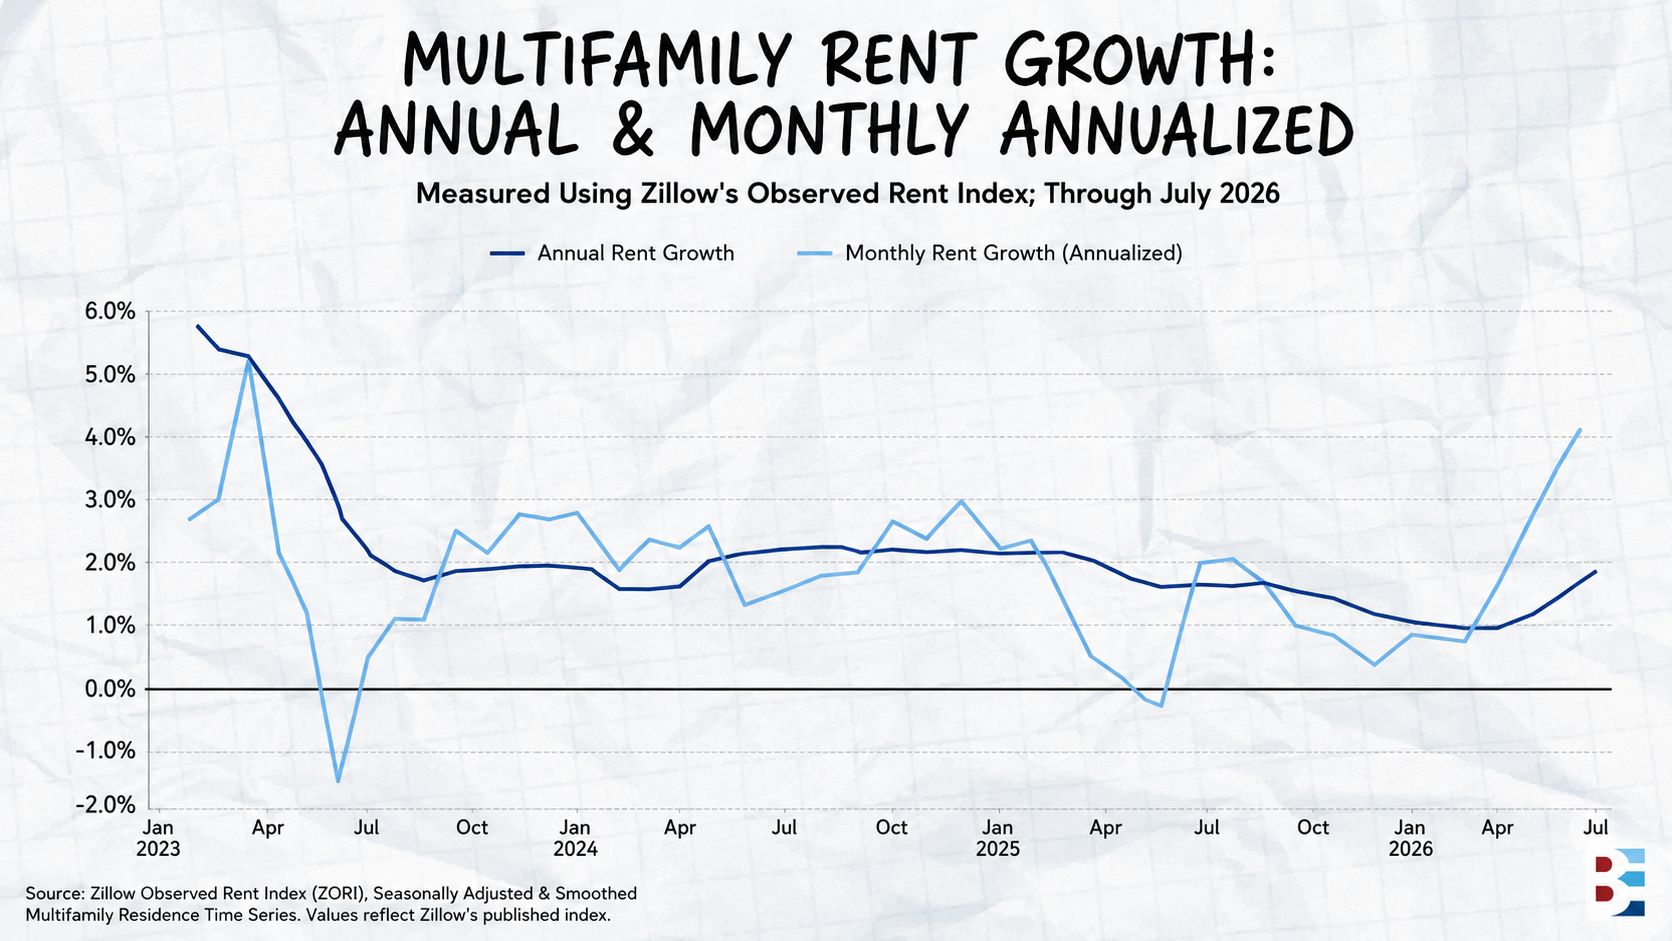
National multifamily rent growth reached 1.8% YoY in July, its fastest annual pace since May 2025, with monthly annualized growth hitting 4.0%, the strongest reading since March 2023. Nearly 89% of metros posted annual gains and 73.4% recorded monthly increases, the broadest participation since September 2025. San Francisco led at 10.3%.
Office net effective rents rose 9.5% over the trailing twelve months to June, with retail close behind at 9.6% and industrial at 3.4%, though office momentum has slowed. Twenty-five of 38 office markets posted positive annual growth. Sacramento industrial jumped 22.5% while Los Angeles and Riverside recorded outright declines of 2.4% and 2.5%, respectively.
Medical outpatient investment volume reached $2.7 billion in Q2, up 24% YoY and 11% above the five-year Q2 average, lifting the trailing-four-quarter total to $14.4 billion. Average sale prices hit $307 PSF, roughly 57% higher than traditional office. Completions fell 76% below the five-year quarterly average as absorption stayed positive for a fifth straight quarter.
Sixty-one percent of private multifamily investors have turned pessimistic on the back half of 2026 as capital-markets volatility persists, and 52% said the first half underperformed their expectations. Nearly half are now underwriting 25 to 50 bps of exit cap rate expansion, while roughly three-quarters assume rent growth no higher than 2.5% through late 2027.
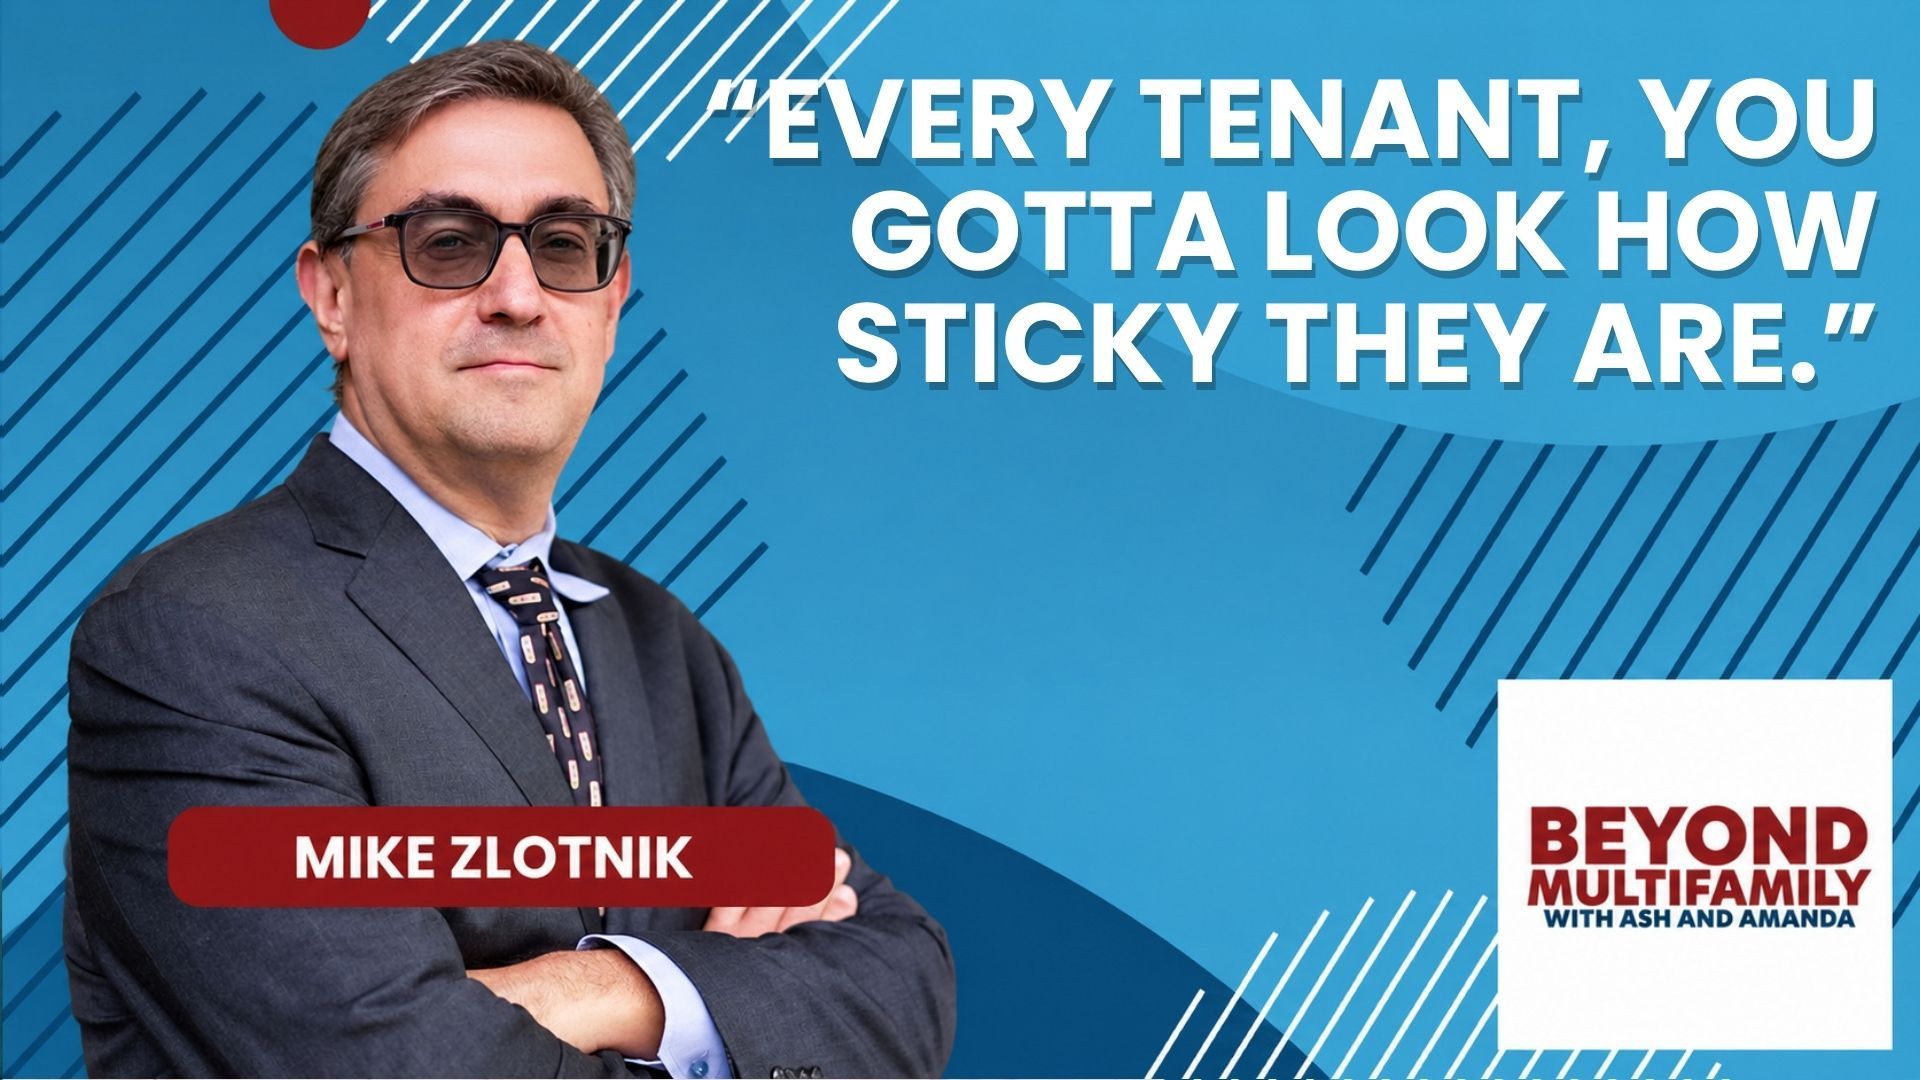
The lease is the asset. That distinction sits underneath every argument for moving capital out of apartments and into industrial, retail, and medical office right now, and it explains why operators who diversified early are sitting in a different position than those who didn't.
On a recent episode of the Best Ever CRE Show, Mike Zlotnik joined Ash Patel and Amanda Cruise to walk through how his fund reallocated away from multifamily concentration and what the other asset classes actually underwrite like.
Annual Leases Versus Contractual Ones: Apartment rents reset every year against whatever supply and demand are doing in that submarket, which means the underwriting is a forecast. Industrial, retail, and medical office run on leases with known terms and known maturity dates, so the revenue side is a documented quantity rather than a projection.
Tenant Credit Replaces Renter Turnover: The underwriting question shifts from what a submarket's renters will pay next year to whether a specific business can service its lease through the term. That work is harder in some ways and far more concrete in others, and it rewards operators willing to dig into a tenant's balance sheet.
Triple Net Absorbs Inflation: When operating costs climbed across the board, triple-net tenants absorbed the increases rather than the owner. Zlotnik also pointed to leverage as the quieter advantage — commercial deals in these sectors typically borrow at roughly two-thirds loan-to-value against multifamily's three-quarters, which changes what a downturn does to equity.
The trade is real. Single-tenant exposure concentrates risk in one credit, and a lease that runs down without renewal takes value with it every year. Zlotnik screens for that by underwriting location stickiness — how expensive it would be for that specific tenant to leave — and by favoring multi-tenant assets where diversification does some of the work.
👉 Listen to Mike’s full episode here.
🙏 Thanks for reading!
Stay in the loop with us! If you received this newsletter from someone else, subscribe here. You can also find us on LinkedIn, Instagram, and YouTube.
Have a Best Ever day!
— Joe Fairless