


The COVID-19 pandemic has accelerated the trend of people, especially the millennial generation, moving out of high-cost gateway markets. Pre-COVID, the millennial generation moved to be closer to family and/or start a family. After the onset of the pandemic, even more people began (and continue) fleeing high-cost gateway markets. For example, since many people are working remotely, they prefer the lower rent payments for a larger unit size rather than paying higher rents for a tiny apartment.
Many suburban, tertiary, and tech hub markets benefited from this migration trend in 2020. Markets with the most growth in 2020 include Sacramento (6.1%), Inland Empire (7.3%), Phoenix (4.6%), Tampa (3.9%), and Las Vegas (3.8), Boise (9.5%), and Scranton-Wilkes-Barre (7.8%), according to YardiMatrix.
2021 is a new year, yet many of the challenges from 2020 remain. Overall, YardiMatrix predicts rents will rise by 2.0% nationally in 2021 (compared to -0.8% in 2020). They predict rents will rise the most in Las Vegas (4.8%), followed by Salt Lake City (4.3%), Austin (3.9%), and Indianapolis (3.9%).
Investing in a market where rents exceed the national average is ideal. While you still want to make conservative rent growth assumptions based on a rental comparable analysis, market-driven rent growth allows multifamily investors to exceed their return projections.
Here are the 10 cities where rents are forecasted to increase the most in 2021:
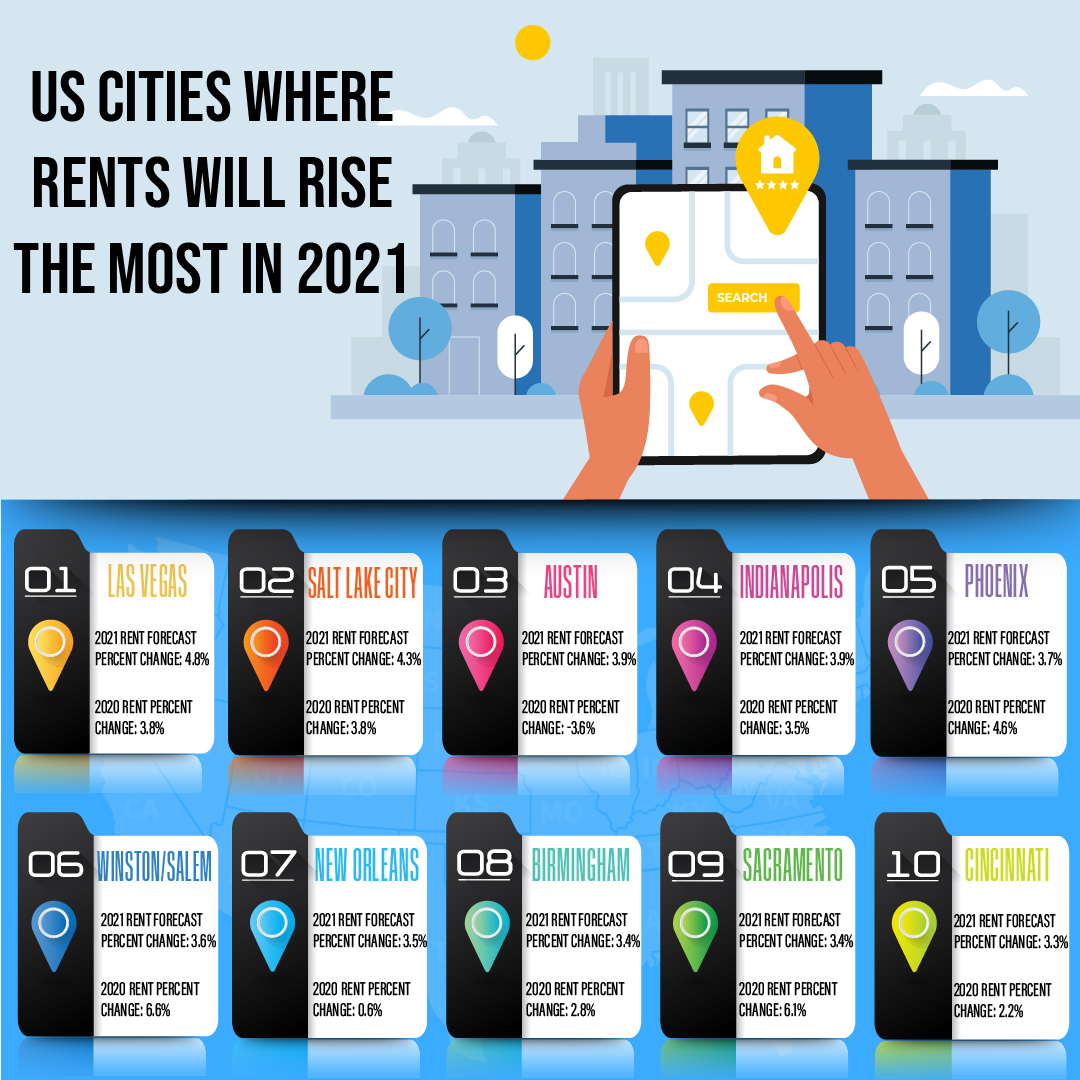
1. Las Vegas

YardiMatrix 2021 Rent Forecast % Change: 4.8% 2020 Rent % Change: 3.8%
2. Salt Lake City
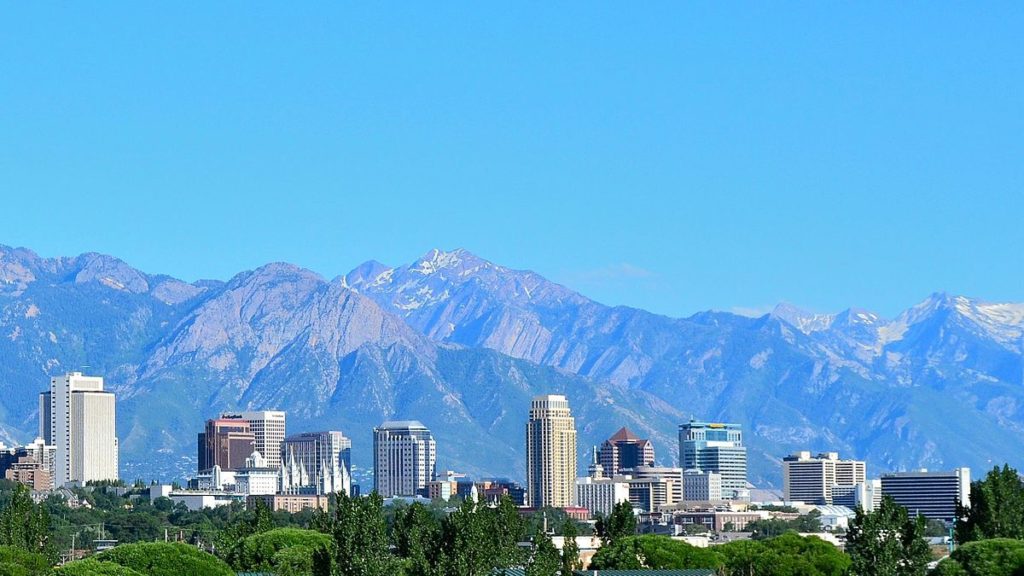
YardiMatrix 2021 Rent Forecast % Change: 4.3% 2020 Rent % Change: 3.8%
3. Austin

YardiMatrix 2021 Rent Forecast % Change: 3.9% 2020 Rent % Change: -3.6%
4. Indianapolis

YardiMatrix 2021 Rent Forecast % Change: 3.9% 2020 Rent % Change: 3.5%
5. Phoenix

YardiMatrix 2021 Rent Forecast % Change: 3.7% 2020 Rent % Change: 4.6%
6. Winston- Salem
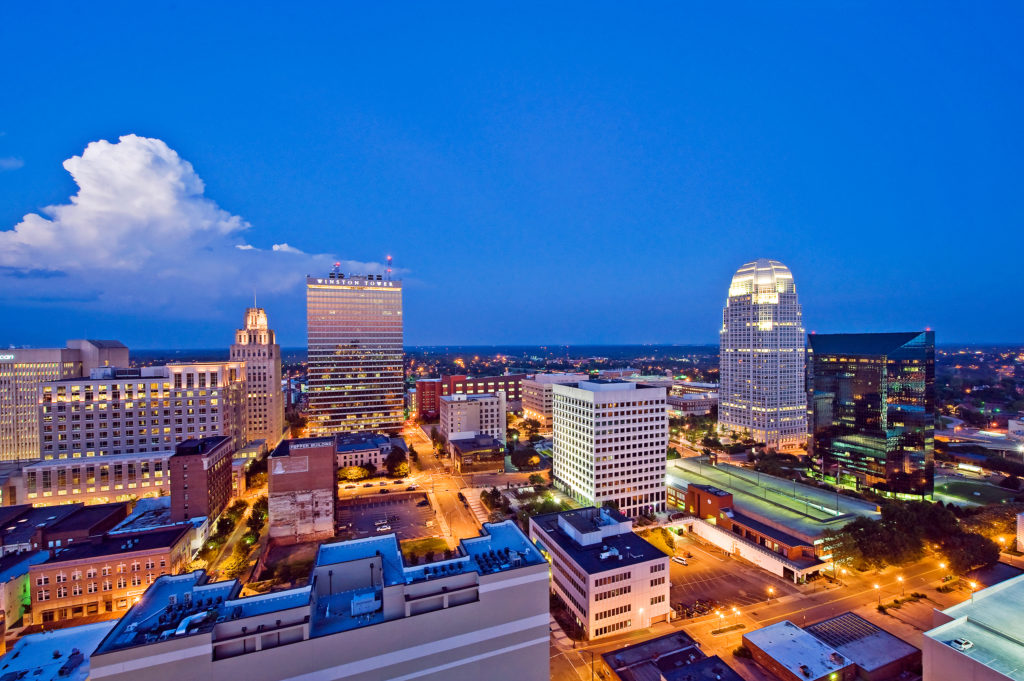
YardiMatrix 2021 Rent Forecast % Change: 3.6% 2020 Rent % Change: 6.6%
7. New Orleans

YardiMatrix 2021 Rent Forecast % Change: 3.5% 2020 Rent % Change: 0.6%
8. Birmingham

YardiMatrix 2021 Rent Forecast % Change: 3.4% 2020 Rent % Change: 2.8%
9. Sacramento

YardiMatrix 2021 Rent Forecast % Change: 3.4% 2020 Rent % Change:6.1%
10. Cincinnati

YardiMatrix 2021 Rent Forecast % Change: 3.3% 2020 Rent % Change: 2.2% Here is a data table summarizing 11 to 20:
| Market | YardiMatrix 2021 Rent Forecast % Change | 2020 Rent % Change |
| Atlanta | 3.3% | 3.0% |
| Columbus | 3.3% | 2.3% |
| Louisville | 3.3% | 1.8% |
| Raleigh | 3.2% | 0.0% |
| Richmond | 3.1% | 6.5% |
| Memphis | 3.1% | 5.9% |
| Tucson | 3.0% | 5.9% |
| Nashville | 3.0% | -1.5% |
| Tampa | 2.9% | 3.9% |
| Houston | 2.8% | -1.9% |
Forecasts are never perfect
Not many people, if anyone, could have predicted that the market with the greatest rent growth in 2020 would have been Boise, Idaho. Therefore, a strong rent growth prediction should not be the only reason why you decide to invest in a market. However, like all forecasts, rent growth predictions are good guides to locating potential investment markets on which you perform a deep dive analysis.