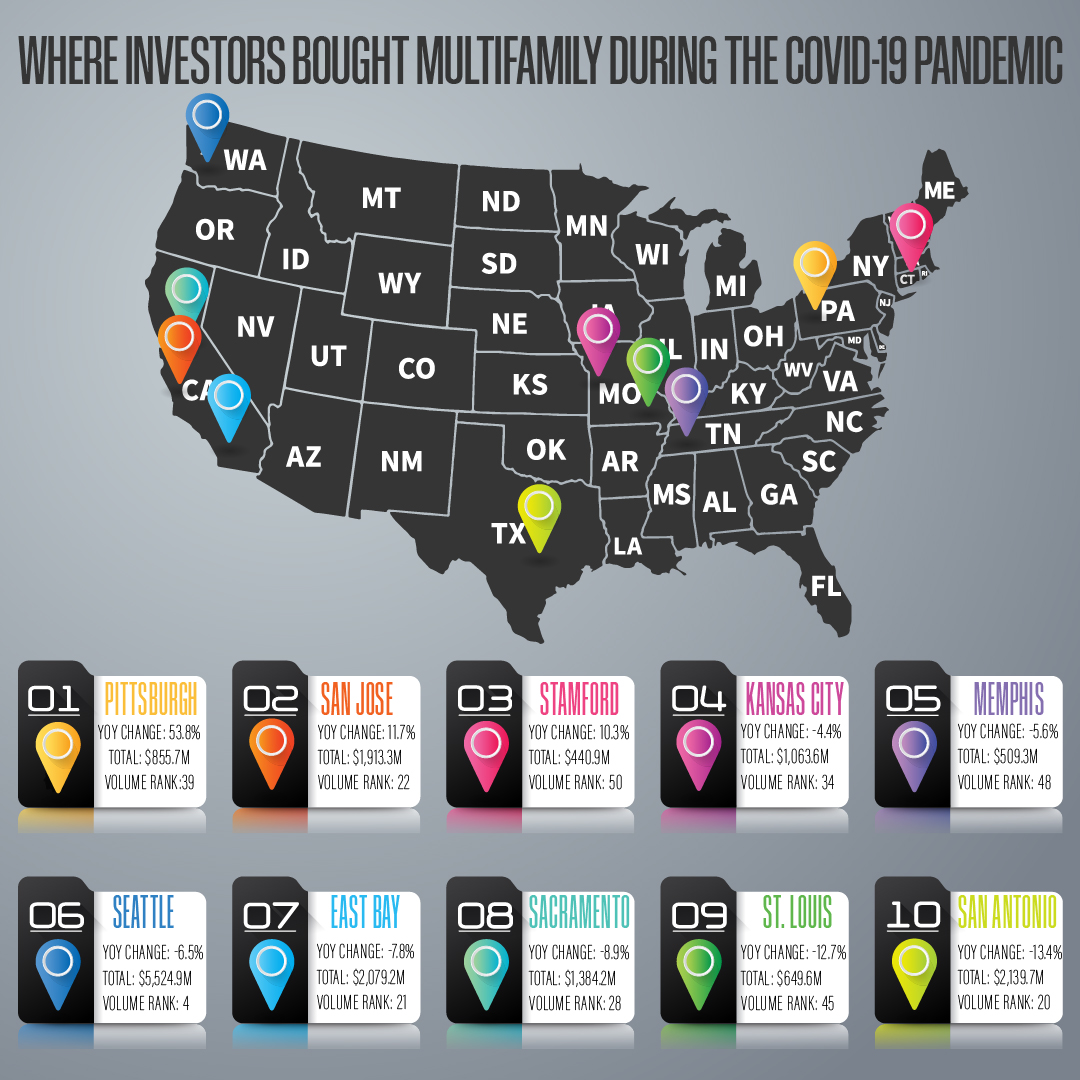
Transaction volume up over 50% in Pittsburgh, San Jose and Stamford, CT only other cities with increased volume
Each year, Integra Realty Resources (IRR) releases their “Commercial Real Estate Trends Report.” Based on long-term and short-term historical economic trends, IRR attempts to forecast how each commercial real estate sector will perform in the coming year.
According to the Federal Reserve Bank of St. Louis, which is responsible for dating recessions, the economy entered a recession in February 2020. And as of this writing, FRED has yet to call the end of the recession.
One dataset included in IRR’s annual trends report is the transaction volume during the prior year. Since the market was in a recession most of last year, the 2020 transaction data provides us insights into where commercial real estate investors were buying up multifamily during a down and uncertain economy. Maybe even more insightful are the markets where investors WERE NOT buying multifamily in 2020.
As a baseline, according to the report, the total multifamily transaction volume in 2020 was down 40% year-to-date, although it still had the highest total transaction volume of the other commercial real estate industries. Only three markets experienced an increase in multifamily transactions in 2020 – Pittsburgh, San Jose, and Stamford, CT. The greatest increase was in Pittsburgh with over 50% more transactions in 2020 compared to 2019, making it one of the “hottest” multifamily market in 2020.
Every other market analyzed experienced a decrease in transactions in 2020. However, some markets more than others. In five markets, the transaction volume in 2020 was down by over 50% – Cincinnati, Inland Empire, Hartford, Cleveland, and Philadelphia.
Here are the 10 markets with the greatest increase in multifamily transactions in 2020:
Here are the 10 markets with the greatest decrease in multifamily transaction in 2020.
| City | YOY Change | Total (4Q2019-3Q2020) | Volume Rank |
| Manhattan, NY | -46.6% | $3,820M | 8 |
| Baltimore, MD | -47.3% | $1,1775.5M | 32 |
| Long Island, NY | -48.3% | $469.5M | 49 |
| NYC Boroughs | -49.0% | $2,656.5M | 15 |
| Washington, DC | -49.8% | $795.2M | 41 |
| Cincinnati, OH | -59.3% | $272.5M | 52 |
| Inland Empire, CA | -60.4% | $1,035.4M | 35 |
| Hartford, CT | -63.2% | $109.6M | 54 |
| Cleveland, OH | -66.9% | $240.2M | 53 |
| Philadelphia, PA | 69.4% | $1,013.4M | 36 |
An interesting takeaway from this data supports something we talk about here a lot on the Best Ever blog: commercial real estate is very submarket and neighborhood dependent. All three top ranking cities are in the same state as a bottom ranking city (Pittsburgh and Philadelphia, San Jose and Inland Empire, Stamford and Hartford). Therefore, before making an investment decision, you need to continue to perform a high level analysis on a submarket and neighborhood level, rather than focusing on city and MSA level data. However, reports such as these can be a guide to determining which cities and MSAs to research further.
Disclaimer: The views and opinions expressed in this blog post are provided for informational purposes only, and should not be construed as an offer to buy or sell any securities or to make or consider any investment or course of action.